More is not always better
November 13, 2020
Dose response is diverse
Our body and cells react differently to the chemical substances we come into contact with. Our body’s reaction (response) to different concentrations (doses) is called dose-response. Small variations in the structure of substances can be decisive for the body’s reaction to the substances. For several groups of substances, it is known that they can be problematic, but theoretically it is not possible to predict how cells or organisms will react to a chemical substance.
As low doses of chemical substances are studied scientifically, more and more otherwise well-known substances are shown to have unexpected effects at low doses. Since the early 1990s, it has been clear that one cannot theoretically – based on a general dose-response formula – predict the response of cells to low concentrations of a substance.
 In everyday life, we regularly experience that there is a linear relationship between dose and effect: Twice as much sugar tastes twice as sweet. Such is the case with the drugs and within the doses we normally use. The graph to the right shows 0-4 teaspoons of sugar in the coffee. It is the linear dose-response that we know best and that we often take for granted in daily life
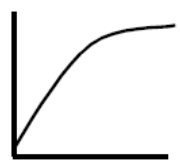 From everyday life we also know of a decreasing effect on a larger dose. Double the dose of sugar in the coffee does not keep giving double effect. When the tongue’s sensation of sweetness is completely filled, an extra dose cannot be sensed. The body’s relationship to a variety of vitamins and minerals works in the same way. The graph to the right shows the experience of sweetness at 1-14 teaspoons of sugar in coffee.
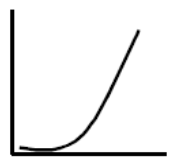 Many substances first have a measurable effect above a certain threshold value as is known from e.g. alcohol. Below the threshold, no poisoning occurs – if you drink an alcoholic beverage with 7,5 ml or 6 grams of alcohol per hour, it has no effect, but if you drink an alcoholic beverage with 30 ml or 24 grams of alcohol per hour, you exceed the liver’s threshold value for continuously breaking down alcohol, after which alcohol continuously accumulates in the blood and you become drunk.
 Some substances used as medicines inhibit processes in the body, so that higher doses inhibit the process more, but only within certain limits. With increasing dose, the inhibitory effect diminishes and eventually disappears. Well-known examples are statins, which lower the blood’s cholesterol content, and drugs that inhibit the stomach’s production of stomach acid.
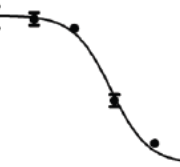
 Some drugs, including several hormones, have a bell-shaped dose-response curve. In addition to the fact that the substances are often active at very low doses, they are also only active within a “window”, so that they have a hormone-like or endocrine disrupting effect above a certain concentration, and then lose effect at higher concentrations. Several hormones and more proteins tested for cancer treatment have this type of dose-response (Reynolds, 2010; Diamond, 2004).
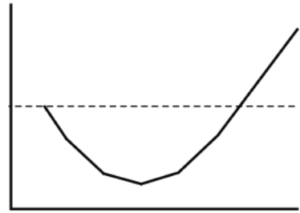 Some drugs have a U-shaped effect curve, so that the drug has a stimulating effect at low doses, but with decreasing effect at slightly higher doses, and then again has a stimulating effect at even higher doses. Several drugs with U-shaped dose-response curves are endocrine disruptors, or promote or inhibit cancer. (Almstrup et al., 2002; Davis & Svendsgaard 1990 and Vadenberg et al., 2012).
Living organisms – including humans – are extremely complex, and the “unexpected” types of non-linear toxic effects can e.g. is due to interactions where a chemical substance can affect sensors on or in the cells, immune reactions, enzymes in the liver, etc.,
In addition, the toxic effects of substances on humans can be determined by individual and often inherited genetic differences. For heavy metals such as mercury and copper, both individual differences and non-linear relationships are known (Andreoli & Sprovieri, 2017; O’Doherty et al., 2019).
In scientific research, organisms’ reactions to chemical substances are often assumed to be linear, so that researchers look for linear relationships without actually knowing if they are relevant. Non-linear contexts are also often overlooked in authorities’ risk assessments of substances. Overall, this means that researchers and authorities often disregard the toxic effects of substances on the basis of a rationale that when a clear toxic effect at low doses was not found at higher doses – well then one can simply ignore these results.
In the EU’s risk assessments of pesticides, GMOs, etc. one often disregards the concrete measurements or experiments that do not meet the requirement of linear and increasing toxicity at higher doses.
Not least Danish researchers such as Almstrup, Grandjean, Skakkebæk and Svendsgaard have helped to focus on non-linear dose response and toxic effects at low and extremely low doses. The same researchers are generally not impressed by the authorities’ ability or willingness to take this new knowledge seriously (Grandjean 2019, Hill et al 2018, Davis and Svendsgaard 1990); – neither is the Vitality Council.
Klaus Sall, cand.scient. in biology
References and further reading
Almstrup K; Fernández MF; Petersen JH; Olea N; Skakkebaek NE and Leffers H. (2002). Dual effects of phytoestrogens result in u-shaped dose-response curves. Environ Health Perspect. 2002 August; 110(8): 743–748. LINK
Andreoli, V., Sprovieri, F., (2017). Genetic Aspects of Susceptibility to Mercury Toxicity: An Overview. Int J Environ Res Public Health 14. LINK
Davis JM og Svendsgaard DJ. 1990 U-shaped dose-response curves: their occurrence and implications for risk assessment. J Toxicol Environ Health. 1990 Jun;30(2):71-83. LINK
Diamond, D. M. 2004. Enhancement of Cognitive and Electrophysiological Measures of Hippocampal Functioning in Rats by a Low, But Not High, Dose of Dehydroepiandrosterone Sulfate (DHEAS). Nonlin. Biol. Toxicol. Med. 2004 Oct.; 2(4): 371–377. LINK
Grandjean, P., Abdennebi-Najar, L., Barouki, R., Cranor, C. F., Etzel, R. A., Gee, D., Heindel, J. J., Hougaard, K. S., Hunt, P., Nawrot, T. S., Prins, G. S., Ritz, B., Soffritti, M., Sunyer, J., & Weihe, P. (2019). Time scales of developmental toxicity impacting on research and needs for intervention. Basic & Clinical Pharmacology & Toxicology, 125(Suppl. 3), 70-80. LINK
Hill C. E., Myers J. P., Vandenberg L. N. (2018). Nonmonotonic dose-response curves occur in dose ranges that are relevant to regulatory decision-making. Dose Res. 16, 155932581879828. 1559325818798282–82. LINK
Lagarde, F., Beausoleil, C., Belcher, S. M., Belzunces, L. P., Emond, C., Guerbet, M., & Rousselle, C. (2015). Non-monotonic dose-response relationships and endocrine disruptors: a qualitative method of assessment. Environmental health 14, 13 (2015), LINK
Montévil M, Acevedo N, Schaeberle CM, Bharadwaj M, Fenton SE, and Ana M. Soto AM. 2020. A Combined Morphometric and Statistical Approach to Assess Nonmonotonicity in the Developing Mammary Gland of Rats in the CLARITY-BPA Study. Environ Health Perspect. 2020 May; 128(5):57001. LINK
Reynolds, Andrew R. 2010. Potential Relevance of Bell-Shaped and U-Shaped Dose-Responses for the Therapeutic Targeting of Angiogenesis in Cancer. Dose Response. 2010; 8(3): 253–284. LINK
O’Doherty, C., Keenan, J., Horgan, K., Murphy, R., O’Sullivan, F., Clynes, M., 2019. Copper-induced non-monotonic dose response in Caco-2 cells. In Vitro Cell.Dev.Biol.-Animal 55, 221–225. LINK
Vandenberg et al. 2012. Hormones and Endocrine-Disrupting Chemicals: Low-Dose Effects and Nonmonotonic Dose Responses. Endocrine Reviews March 14, 2012 er.2011-1050 LINK
Zoeller RT, Brown TR, Doan LL, Gore AC, Skakkebaek NE, Soto AM, Woodruff TJ, Vom Saal FS. Endocrine-disrupting chemicals and public health protection: a statement of principles from The Endocrine Society. Endocrinology 2012; 153:4097 – 110; LINK